


Retrospectives provide software project teams an opportunity to look back and reflect on how a just-completed project iteration or project itself has gone and what can be done to improve the current project or the next project in the backlog. A retrospective typically tries to answer the following:
- How did we do?
- How are we doing?
- How can we do better?
During a retrospective, the team has an opportunity to review various pieces of project information to draw meaningful insights in an attempt to address and answer these questions. The most commonly reviewed information consists of burn down charts, burn up charts, and velocity charts. These charts provide valuable feedback on how well the team performed over the time period being reviewed, and they provide a means to estimate future capacity and likely progress. These charts are high-level roll-ups of iteration and project activity and provide answers to certain questions. However, they may not provide as full a picture as desired and additional perspectives may need to be considered to help augment the project picture. Additional information can come from the relative efficiency of the project work effort.
Beyond Burn Down, Burn Up, and Velocity
While a review of burn down, burn up and velocity charts may satisfy project reflection needs and goals for most organizations’ retrospectives, you can go further and look at the following four measures of efficiency for the work estimated and work performed:
- Story Point Efficiency
- Estimated Hours Efficiency
- Work Efficiency
- Story Point Load
In addition to reporting simple Story Point velocity (e.g., how much work was accomplished), you can report on Story Point efficiency (e.g., how much of the committed work was actually accomplished). Velocity addresses demonstrated team capacity while efficiency addresses perceived team capacity. Both should be reviewed during a retrospective to explore how to do better.
Expressed computationally,
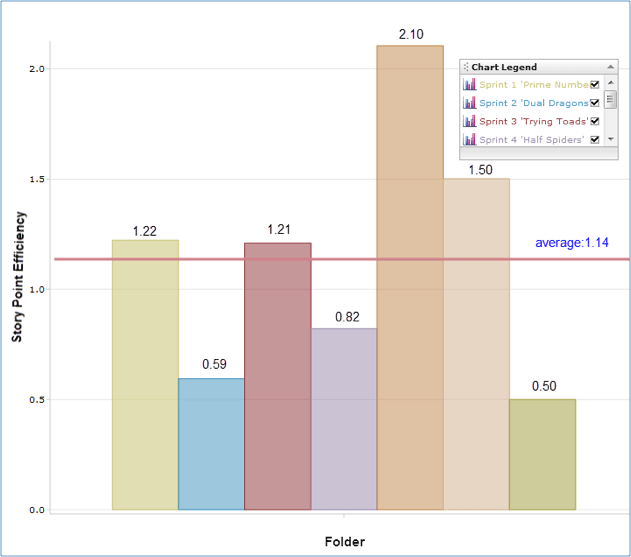
Story Point Efficiency = (Story Points delivered) / (Story Points promised)
A retrospective chart like the following describes Story Point efficiency by iteration, as well as average efficiency across all iterations. For this project, Story Point efficiency ranged from 0.50 to 2.10, and averaged out at 1.14: 14% more Story Points were delivered than promised.
If your project methodology calls for estimating effort and capacity in terms of hours to provide promised functionality and monitoring effort velocity in terms of actual hours expended to deliver promised functionality, then you can also report on Estimated Hours efficiency. As with Story Point efficiency, Estimated Hours efficiency addresses perceived team capacity and should be reviewed during a retrospective to explore how to do better.
Expressed computationally,
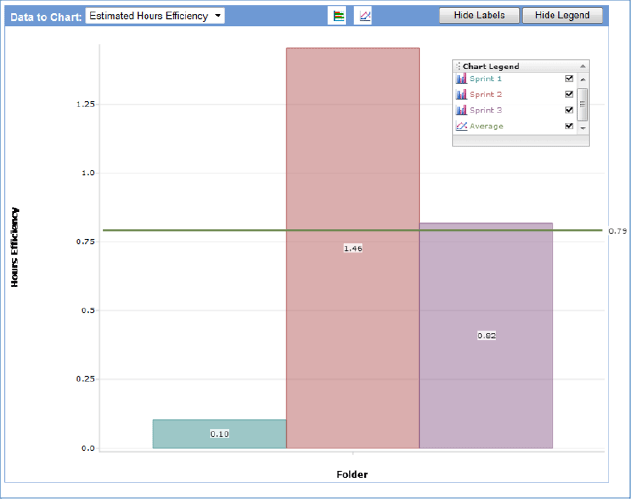
Estimated Hours Efficiency = (Estimated Hours) / (Actual Hours)
A retrospective chart like the following can describe Estimated Hours efficiency by iteration as well as average efficiency across all iterations in a release. Within the three sprints reported upon for this project, the total estimated effort time within each sprint ranged from 10%-146% of what was actually expended, and on average was about 79% of actual.
A third efficiency area that should have retrospective review deals with Work efficiency. Project, iteration, or User Story work consists of two components: original work and rework. Original work is the effort to initially deliver the promised functionality without any team or customer-identified defects. Rework is all additional effort to address and fix any team or customer-identified defects which are preventing delivery of the functionality. Work efficiency is a relative measure of rework: how much of the total effort to get promised functionality out the door involved additional work (e.g., rework) to fix team- or customer-identified defects.
Expressed computationally,
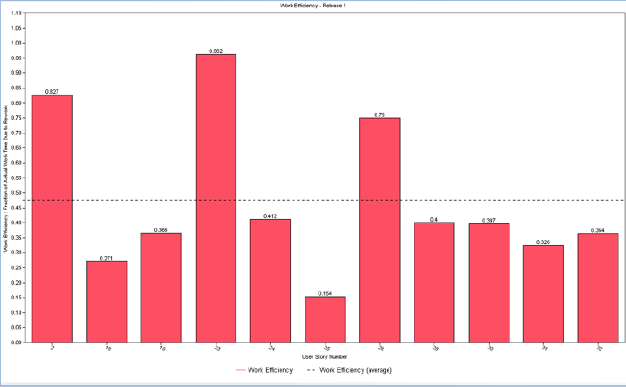
Work Efficiency = (Rework Hours) / (Actual Hours)
where Actual Hours = Original Work Hours + Rework Hours
If a User Story, iteration, or project had no rework, then Work efficiency for that level of effort would be 100%.
Retrospective reviews of Work efficiency, coupled with root cause analysis of extreme situations, may provide insights into how to do better during the next go-around. A retrospective chart like the following shows the Work efficiency for User Stories within a release: rework time ranged from 15%-96% of total actual work time, and averaged almost 50%. This relatively high level of rework may be a major topic of retrospective review.
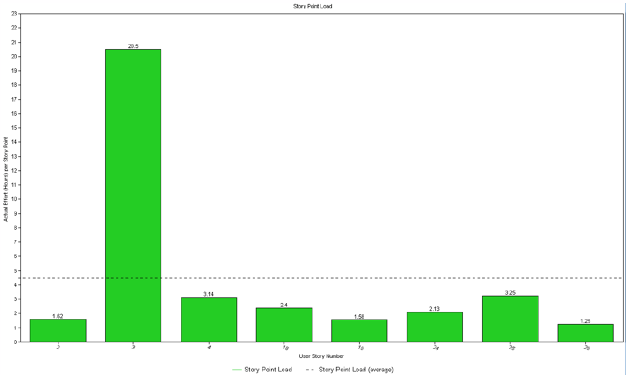
A fourth efficiency area that should have retrospective review deals with Story Point load, a ratio representing the actual effort, in hours, expended to work on, and deliver, one Story Point of functionality. This metric provides correlation between estimated functionality difficulty (Story Points) and recorded effort (Actual Hours) to deliver the functionality. It can prove useful during sprint planning, in conjunction with velocity estimates, when the team is making Story Point estimates and assessing meaningful sprint workload commitments.
Expressed computationally,
Story Point Load = (Actual Hours) / (Story Points)
where Actual Hours = Original Work Hours + Rework Hours
The following retrospective chart presents Story Point loads for User Stories in an iteration, as well as the average Story Point load across all stories in the iteration. The chart readily indicates that User Story #3 required seven times the actual effort compared to the other stories in the report. The retrospective may choose to follow up to determine why this happened.
If your organization uses Seapine Software’s TestTrack® tool to manage Agile projects, you can create customized reports to address efficiency and add them to your retrospective toolbox. A related article, Use TestTrack Metrics to Measure and Manage Software Project Rework, addresses original work, rework, and workflow metrics and provides graphical report examples. Another related article, Add Story Point Metrics To Your Agile Software Project Toolbox, addresses Story Points and the estimated and actual effort to deliver them.
Take full advantage of available data and display tools, and you will maximize the reflective value of your retrospectives and be able to productively answer:
- How you did
- How you are doing
- How you can do better
The investments you make now toward building a robust analytic display toolbox will pay dividends to you in current and future projects. Good luck!