As I discussed in a previous blog (The Impact of the Increase in Life Expectancy), with the projected dramatic increase in the senior citizen population, we can expect a corresponding increase in the demand for various products and services needed to support this population. Since the vast majority of elderly Americans live at home, one of these areas will most likely be home health care. Many health care treatments that were once offered only in a hospital or a doctor’s office can now be done in the home and are usually less expensive, more convenient, and just as effective as the quality of care in a hospital or skilled nursing facility.
In order to help consumers find and assess home health care providers, the Center for Medicare and Medicaid (CMS) created Home Health Compare.This site has information about the quality of care provided by Medicare-certified home health agencies throughout the nation. “Medicare-certified” means the home health agency is approved by Medicare and meets certain federal health and safety requirements.
How is Quality of Care Defined?
Medicare uses measures called “quality measures” to assess the quality of certain aspects of nursing home care, like whether patients have gotten better at moving around, are in pain, or have improved breathing. Home Health Compare has two types of quality measures:
Process of Care Measures: These tell you how often an agency provided the recommended care. For example, checking patients for depression at the beginning of an episode of care is recommended. A rate of 88% means that the agency provided the recommended process of care in 88% of their home health episodes of care.
Outcome of Care Measures: These tell you about the results of the care an agency provided. For example, by the end of an episode of care, did the patient’s ability to ambulate improve? A rate of 88% means that the agency achieved that outcome in 88% of their episodes of care.
Along with these two different types of data, there are also 20 quality measures to help create an overall picture of quality and patient satisfaction, that are broken up in four groups and five patient survey results.
Groups of Quality Measures
Managing Daily Activities
- How often patients got better at bathing
- How often patients got better at getting in and out of bed
- How often patients got better at walking or moving around
Managing Pain and Treating Symptoms
- How often patients had less pain moving around
- How often patient’s breathing improved
- How often the home health team checked patients for pain
- How often home health team treated symptoms of heart failure (weakening of the heart)
- How often the home health team treated their patient’s pain
Treating Wounds and Preventing Pressure Sores
- How often patient’s wounds improved or healed after an operation
- How often the home health team checked patients for the risk of developing pressure sores
- How often the home health team included treatments to prevent pressure sores in the plan of care
- How often the home health team took doctor-ordered action to prevent pressure sores
Preventing Harm
- For patients with diabetes: How often the home health team got doctor’s orders, gave foot care, and taught patients about foot care
- How often patients got better at taking their drugs correctly orally
- How often the home health team began their patients care in timely manner
- How often the home health team checked patients for depression
- How often the home health team checked a patient’s risk of falling
- How often the home health team made sure their patients had received a flu shot for the current flu season
- How often the home health team made sure their patients had received a pneumococcal vaccine
- How often the home health team taught patients about their drugs
Patient Survey Results
The purpose of the survey is to gather information from patients (or their family or friends) about their experiences with a home health agency. Overall it measures:
- Patients who gave their home health agency a rating of 9 or 10 on a scale from 0 to 10
- Patients who reported that their home health team communicated well with them
- Patients who reported that their home health team discussed medicines, pain, and home safety with them
- Patients who reported that their home health team gave in a professional way
- Patients who reported YES, they would definitely recommend the home health agency to friends and family
What About this Data?
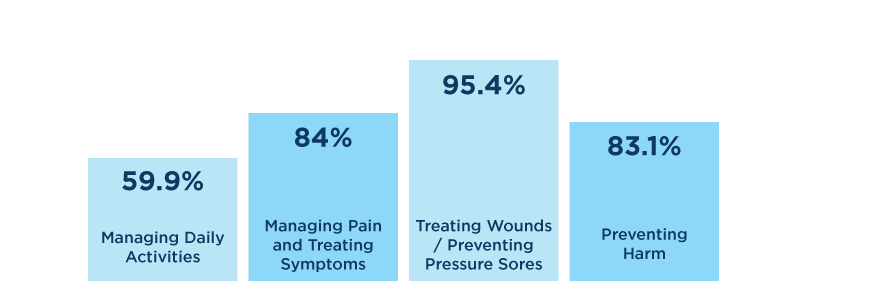
First, we calculated scores for each group by adding the scores for each measure within that group and calculating a national average:
We then conducted some basic statistical analysis of the data (Max, Min, Mean, Mode, and Standard Deviation) which yielded some interesting findings.
As you can see from the table above, Treating Wounds/Preventing Pressure Sores is a quality of care that most of the agencies perform well. We found high scores with low deviation. Whereas, the Managing Daily Activities has a low score, but high standard deviation.
Now when you look at Managing Pain and Treating Symptoms, the score of these two groups seems low, but that is misleading. Most measured in these groups had high scores and low standard deviation. For instance in Managing Pain and Treating Symptoms the measures: “Improved Breathing” and “Improved moving around” lowered the average from what would be 98.1%, to 84%. Similarly, for the Preventing Harm group, if you exclude the measures “Got better taking drugs orally”, “Patient had recieved flu shot” and “patient had received pneumococcal vaccine” the average would then be 94.4%, instead of 59.9.
So when we looked more into these low scores we saw that all of them were about the results of the care provided, whether the patient improved or not. In addition, all of the high scores, which are all above 80%, are all about whether the team did or did not provide the recommended care. So in general, most of the agencies performed well in the administration of care but for the results of care the scores between agencies vary greatly and are quite low.
Is There Any Correlation Between Quality Care and Patient Satisfaction?
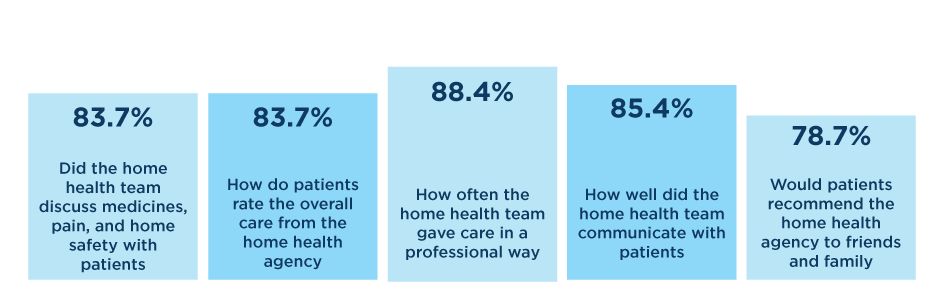
Then, we calculated the national averages for each of the Survey results:
Then we thought it would be interesting to look for correlations between the quality of patient care and the survey results to see if certain quality measures would have more of an impact on the patient survey results- like if the patient would recommend the home health care to friends and family. But surprisingly, there was no correlation at all which means there is no particular quality of patient care measure or group of measures that determinates the satisfaction of the patients.
Of the five survey measures listed above, we assumed that the most important measure of patient satisfaction would be whether or not a patient would recommend the home health agency to friends or family. Interestingly, the measure had the lowest score of the five survey measures.
Which State Has the Best Quality of Patient Care?
Finally, we thought it would be interesting to look at the averages of the quality of patient care and survey results by state to see which areas in the US offer a better quality of care for these different measures collected. If you are interested in researching specific providers in a state, click here.
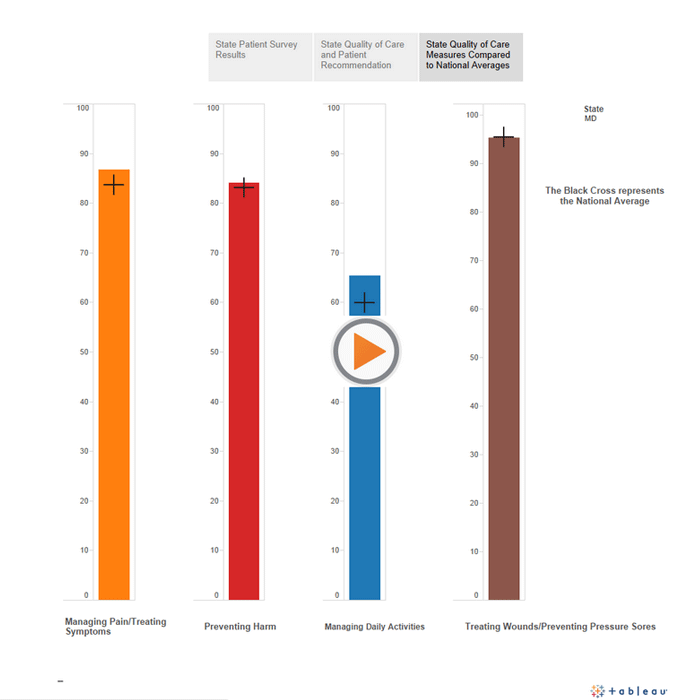
The following three visualizations provide information and insight into how each state performed with respect to quality of care and patient survey results:
- State Patient Survey Results: We calculated the score for whether a patient would recommend the home health agency to a friend for each state and compared that score against the national average.
- State Quality of Care and Patient Recommendation: Shows both the patient recommendation and a composite quality of care (average for all quality of care measures) for each state.
- State Quality of Care Measures Compared to National Averages. Select a state to view the quality of care score for each group compared against the national average