Debugging is an unavoidable part of the software development process. It is also, by far, the most time consuming activity. Every hour of development seems to be accompanied by a few hours of debugging, which is why as a developer it is important to be able to quickly identify and resolve issues. In this blog we will go over basic usage of Developer Tools for JavaScript debugging.
Developer Tools
Developer Tools are a set of tools built into every mainstream browser. These are essential for every web developer to know how to use on at least a basic level. I’ll be using Chrome’s version of Developer Tools or “DevTools” in this blog, but the functionality is pretty much similar across all browsers. Let’s begin by pressing F12 in your browser.
Basics
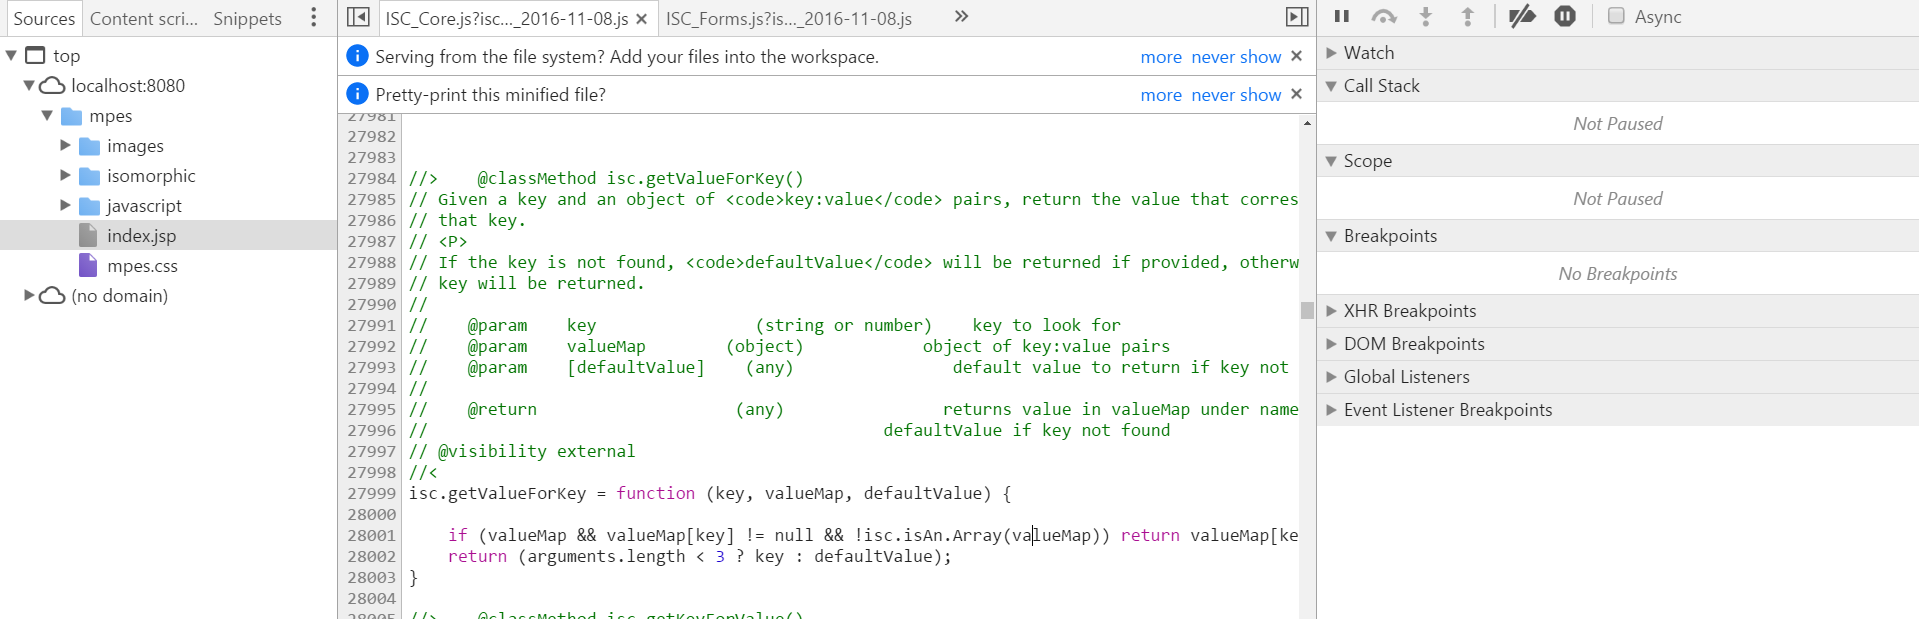
After pressing F12, you should see a screen similar to the one above. You should immediately be under the Sources tab, and make sure to select it if you aren’t. In this pane your files are on the left and you can find a specific file there or use CTRL-P to search for a specific file. The middle panel displays the content of the currently selected file.
Breakpoints
The first thing to do when debugging is setting a breakpoint. You can use the debugger statement in JavaScript or find the line in DevTools and left click the line number to set a breakpoint. Upon hitting the breakpoint, you will see the following on the rightmost pane. Breakpoints will remain even on page reload.
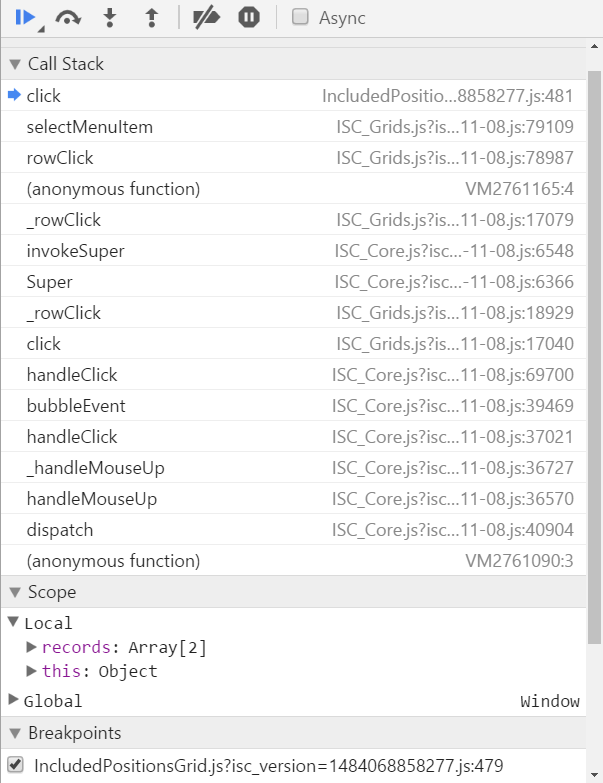
If you have used debugging tools in other IDE’s this should look very familiar to you. The top buttons let you Run, Step Over, Step In and Step Out, deactivate breakpoints, and pause on exceptions respectively. This lets you navigate the code at your own pace so you can see what is changing step by step. The call stack shows what has been called up to this point and you can click through to see the flow of the code.
The scope is what I find the most useful. You can bring up variables within the current scope and see how they change as you step though the code. An important thing to note is that although you can see variable contents in the middle body panel by hovering over variable names, I find it easier to just declare the variable or you’ll have to re-expand nested variables each time you want to look.
Console
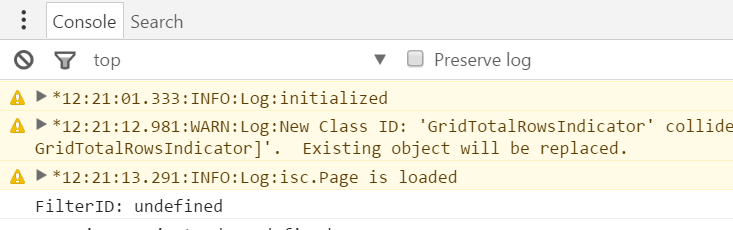
The console, located at the bottom of the screen, is a pretty useful tool for immediately identifying errors. You can print messages to the console with console.log()/info()/warn()/error(), whichis very useful if error handling is set up properly. Often, the first place I look if I encounter a bug is the console to see what the issue is.
Readable Code
A lot of frameworks minify their code for performance which can be annoying for debugging purposes. Fortunately, DevTools comes with a useful feature ‘Pretty Print’, which will de-minify your code and make it readable. Just go to your file and click the curly brackets icon located at the bottom of the body panel.
Searching Source Code
DevTools has a find-in-files feature, hit CTRL+SHIFT+F to search. The goal is to debug/edit as much as you can within the browser without having to reload or redeploy your application.
DevTools has become an essential piece of technology front-end developers must know. There is simply no better way to debug JavaScript. This is just an introductory guide, for more in-depth information, please check out the main page at https://developer.chrome.com/devtools.